Data plotting
Introduction
After a call to
frame , one can in several ways visualise (X,Y)-data specified by NP points. DLAB, NP, XA and YA are common parameters of the data plotting routines.
- DLAB (string)
- is a label describing the data. DLAB is displayed the legend together with an indication of the way the data are drawn. (UNIX workstations <= 48 characters, Cray <= 64 characters) XA (real array)array containing the X-coordinates of the NP points. YA (real array)array containing the Y-coordinates of the NP points. NP (integer <= 10000)the number of points to plot. The lower bound of NP depends upon the visualisation method. Mind that the total number of points of a complete graph is also 10000.
The mapping of the coordinates to the axes is defined by frame. If desired, the coordinates are used to compute automatically the axis numbers. For a logarithmic axis, Komplot performs the 10 logarithmic transformation of the coordinates. Coordinates <= 0.0 are omitted! PostScript line width and grayvalue can be changed.
Lines
-
POLYLINE (DLAB, NP, XA, YA) - Successive points are connected by straight lines. NP>=2.
-
DISJOINT_LINE (DLAB, NP, XA, YA) - Point 1 and 2, 3 and 4, 5 and 6, ... are connected by straight lines. NP>=2.
Interpolation
-
CURVE (DLAB, NP, XA, YA) - Successive points are connected by a smooth interpolated curve (Akima interpolation). NP>=3
-
CLOSED_CURVE (DLAB, NP, XA, YA) - Same as CURVE, but last point connected to first point.
- (
SPLINE (DLAB, NP, XA, YA))
Markers, errorbars
-
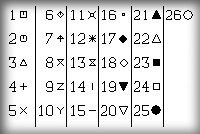
MARKERS (DLAB, NP, XA, YA, ISYM) - All points are plotted with a marker defined by ISYM. NP>=1. ISYM is an integer chosen from the table.
-
SCALE_MARKERS(scale_factor) - The height of the markers (default 0.21 cm) can be scaled with
Scale_markers. It must be called beforeframe! -
V_ERRORBARS (DLAB, NP, XA, YA, EA) - Vertical errorbars, specified by the real array EA, are drawn. Point I has an errorbar from YA(I)-EA(I) to YA(I)+EA(I). Errorbars are automatically transformed for a logarithmic axis.
-
H_ERRORBARS (DLAB, NP, XA, YA, EA) - Horizontal errorbars, specified by the real array EA, are drawn. Point I has errorbar from XA(I)-EA(I) to XA(I)+EA(I). Errorbars are automatically transformed for a logarithmic axis.
-
VAR_MARKERS (DLAB, NP, XA, YA, ISYMA) - Each point has its own marker type specified by the integer array ISYMA. NP>=1.
-
VAR_SCALE_MARKERS (DLAB, NP, XA, YA, ISYM, SA) - All points are marked by the same marker defined by ISYM, but the height of separate markers are scaled by values in the real array SA. 0.1<=SA(I)<10.0. NP>=1.
Approximation
-
LOCAL_PARABOLA_AP (DLAB, NP, XA, YA, NREPEAT) - Local parabola fitting (Lanczos) on 5 successive points. The process is repeated NREPEAT times. NP>=5, X-coordinates equidistant.
-
SPLINE_AP (DLAB, NP, XA, YA, SSQ) - Cubic spline approximation with knots same as X-coordinates of points. SSQ is the sum of squares of deviations and controls the approximation. SSQ = 0 : interpolation. NP>=5.
-
W_SPLINE_AP (DLAB, NP, XA, YA, WA, SSQ) - Same as before, but now points have weighting factors in the real array WA.
-
SPLINE_VAR_KNOTS_AP (DLAB, NP, XA, YA, NK, XKA) -
W_SPLINE_VAR_KNOTS_AP (DLAB, NP, XA, YA, WA, NK, XKA)
Bardiagram
-
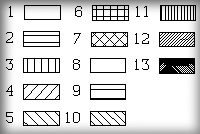
BARS (DLAB, NP, XA, YA, IFILL, WIDTH) - (XA(I), YA(I)) defines the centre of the top line of bar I. NP>=1.
-
WIDTH(real) - is the barwidth
-
IFILL(integer) - defines the filling as shown in the tabel
Fill area
-
FILL_AREA (DLAB, NP, XA, YA, IFILL) - An area defined by NP points (last point connected to first point) is filled according to the value of IFILL, see Bardiagram. NP>=3 PS_FILL_AREA (DLAB, NP, XA, YA)
- An area defined by NP points (last point connected to first point) is filled at a PostScript printer with a gray value defined by . A next call must define linewidth and grayvalue of following Komplot calls. NP>=3
Final remarks
- Parts of the data outside the border are cut off (clipped).
- line type ..., line style ...
- abs(NP) = number of points.
NP > 0 : coordinates in units defined byframe
NP < 0 : coordinates expressed in cm relative to the origin - DLAB can be empty : no label in legend.
- If the first character of DLAB is a minus sign (-), which is not plotted, no indication of the data is plotted before DLAB in the legend.
-
SUPPRESS_ERRORBAR_CROSSLINES(L)can be used to change errorbars.
Last modified:04 October 2024 12.41 p.m.


