The trade costs of 'making America great again'

The credo ‘Make America Great Again’ (MAGA) was a key part of the US presidential campaign by Donald Trump in 2016. International trade was an important element of reasoning behind the MAGA slogan. According to Trump, the deficit on the US current account indicated that other countries benefitted more from international trade with the US than the other way around. He vowed that if he would become president of the US, he would try to put an end to this ‘unfair’ state of affairs. He kept his promise. After he became president, trade issues were high on his policy agenda from day one: he withdrew from the Trans Pacific Partnership (TPP, a trade agreement between countries around the Pacific), he initiated a re-negotiation of the existing NAFTA treaty (a trade agreement between the Canada, Mexico and the US), and introduced a range of import tariffs.
In January 2018, the US imposed a 30 percent tariff on solar panels, and a 20 percent tariff on washing machines. The tariff on solar panels was particularly aimed at China, the country with which the US has the largest trade deficit. The introduction of these tariffs was met with disbelief and criticism, as it turned the clock back to a situation where countries fought self-defeating trade wars with each other with ever-increasing import tariffs. Tariffs are a distortion in the global economy and interfere with the global division of labour. Somewhat ironically, the protected solar panel industry objected strongly against the protection they received from their president. Solar panel production is only marginal in the US and electrical mechanics, who install solar panels, were afraid that they would go out of business because solar panels would become too expensive because of the tariffs.
The consensus among economists is, that despite the fact that trade creates winners and losers, international trade is in principle welfare-increasing, and introducing or increasing tariffs makes countries and their citizens worse off.
In March 2018, Trump ordered a second round of tariffs, this time on steel (25 percent) and aluminum (10 percent). Initially, some countries were exempted from these tariffs (the EU countries, Canada, Mexico and South Korea), but not China. The rest of the world was not amused and promised the US that they would pay back in kind, and indicated that the US tariffs would be countered by similar tariffs on US goods. For president Donald Trump these threats are an indication that the basic message, namely that trade is ‘unfair’ for the US, is still not understood by the rest of the world and he responded by announcing additional tariffs on hundreds of imported goods. Not surprisingly, China, the EU, Mexico, Canada and India reacted with additional threats of extra tariffs on hundreds of goods from the US.
Although many of these announcements are still only threats, it seems that the world is close to a global trade war, something that we have not witnessed since the 1930s. What are the economic consequences of such a trade war?
To answer this question, we apply the gravity model to analyse the consequences of a trade war (see Brakman et al. 2018 for details of the gravity model that we use here). The basic idea behind the gravity model is simple: the larger the economic size of trading partners, the larger the trade volume between these countries; however, if the ‘ distance’ between countries increases, the trade flows become smaller. Distance is a broad concept: it not only refers to geographic distance in kilometers, but also to cultural, institutional, language and historical differences between countries. And this also includes ‘distances’ as represented by a tariff: the higher a tariff, the ‘further apart’ countries are and the smaller their trade flows.
We apply this concept to the possibility of a trade war and investigate the consequences. The baseline is the current situation without a trade war. In step 1, the US increases trade costs by 15% on goods from Canada, Mexico, China, the EU, and India (we apply an average tariff for total trade). In step 2, these countries retaliate with a 15% increase in trade costs for US goods. The US answers in step 3 by additional retaliatory tariffs, again with 15% (this implies a 30% combined increase in tariffs compared to the baseline). The fourth and final step is a similar tariff increase by the other countries. This is our definition of a trade war; a 30% increase of mutual tariffs in 4 steps.
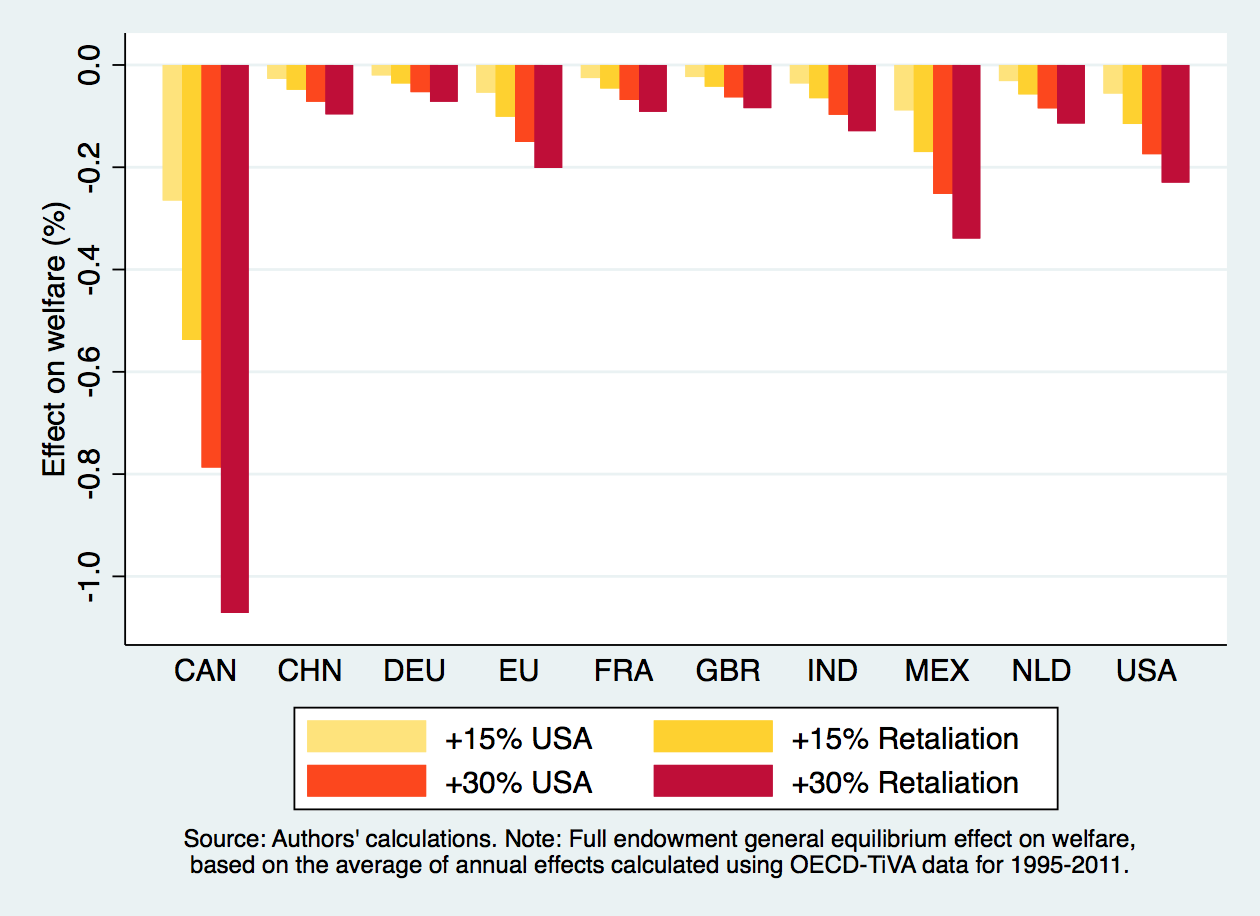
Figures 1 and 2 show our results.

(Supporting statistics for all countries in our sample are provided in the online table (is no longer available). Note that we use so-called value-added export data, which give a better indication how countries are hit by a trade war than so-called gross-export data. Value-added data only look at that part of production that takes place within a country itself, and correct for the imports of intermediate goods that are needed to produce a final good.)

A few observations stand out. A tariff makes imported goods more expensive, which results in a reduction of trade for all countries involved. When we look at the effects of a trade war of this magnitude on the amount that countries trade, the big loser is the US. This is because all other countries take retaliatory measures against the US, but not against each other.
So, under this scenario Trump loses big time.
The final result is a reduction of trade of 20% for the US. But all countries face the negative effects. In particular, neighboring countries like Canada and Mexico are hit severely, because they are highly dependent on trade with the US. Trade losses for China are modest and are around 2.5%, because China is also dependent on trade with other large areas or countries like the EU, or Japan; it has alternatives for trade that are nearby, and according to the logic of the gravity model these are important trading partners. This also helps explain the relatively modest reduction for The Netherlands of about 1.5%.
The model we apply can also give some indication of welfare changes (that is, income losses). Figure 2 shows these losses. Canada, which is highly dependent on trade (with the US) loses the most, 1% of its gross domestic product (GDP), but a country like the Netherlands is also hit by a trade war and income could decrease by 0.15. The US loses more than 0.2% of GDP. The figures implicitly show the differences between individual countries; some countries are facing high tariffs in the US and are also highly dependent on trade with the US (like Canada). Other countries are also hit by the tariffs but have alternative markets that are nearby, such as The Netherlands (highly dependent on trade with the EU).
(The CPB (2018) and DNB (2018) also calculated the effects of a trade war. Our welfare results are somewhat smaller than presented by the CPB or DNB, but are otherwise consistent. See also Krugman (2018) on why welfare effects are modest.)
The conclusion of our analysis is straightforward: a global trade war initiated by the US is bad for all countries involved, and particularly for the US itself, and only results in trade and welfare losses. This is hardly a surprising conclusion for students that paid attention in their international trade classes.
Read more:
- Brakman, S. H. Garretsen, and T. Kohl (2018), Consequences of Brexit and options for a ‘Global Britain’, Papers in Regional Science, Vol. 97, pp. 55-72.
- CPB (2018), Trade Wars: Economic Impacts of US Tariff Increases and Retaliations, CPB Netherlands Bureau for Economic Policy Analysis, The Hague.
- Krugman P. (2018), Thinking about a Trade War, New York Times, June, 17.
- DNB (2018), Economische Ontwikkelingen en Vooruitzichten, juni 2018, De Nederlandsche Bank, Amsterdam.

