Rivalry is dynamic, but patterns of rivalry can be quite stable
| Datum: | 03 december 2021 |

You probably have a good idea about which firms are the direct rivals for your own firm. Their strategic actions could have a noticeable impact on your firm’s performance. Consequently, you probably keep a close eye on those firms and consider ways to counter their strategic moves. However, do you know which firms your rivals are reacting to, and which firms their rivals react to, and so on? Competitive actions of one firm can trigger ripple effects that extend far beyond that firm’s immediate set of rivals.
I noted in my previous blog, that the patterns of interdependence within an industry can be mapped using strategic groups. Firms that hold very similar strategic positions are likely to compete against each other upstream for suppliers and/or downstream for customers. Hence, they can influence each other’s performance—they are interdependent. In contrast, firms holding quite different strategic positions are less likely to get in each other’s way like this. Hence, they are relatively indifferent towards each other’s actions. With this in mind, strategic groups (clusters of firms holding similar positions) can be thought of as islands of interdependence separated by a sea of indifference.
An analysis of strategic groups can indicate how far the ripple effects competitive actions might reach. Perhaps more importantly, it can identify the boundaries that can halt the spread of those effects. In the absence of such boundaries, competitive reactions could engulf the entire industry and severely limit the profitability of all firms. However, gaps in the networks of interdependence can shield groups from each other and allow pockets of oligopolistic competition to emerge within the industry. This creates the potential for greater profits
So, strategic groups are interesting, but how stable are they? Would a strong environmental shock rearrange the patterns of rivalry within an industry? To find out, we analyzed the strategic groups of banks in Chicago before, during, and after the financial crisis (2001-2003, 2008-2010, 2013-2015, respectively).
Despite this enormous shock, the strategic groups were remarkably stable. The simplest labels for these groups would be small (S), medium (M), and large (L) banks based on total assets. However, we corrected for size by grouping the banks based on a variety of ratios (e.g., the percentage of deposits that are from retail customers, the percentage of loans targeting the commercial & industrial segment, liquidity). All of the variables show strikingly similar patterns. Banks of different sizes adopt different strategic orientations.
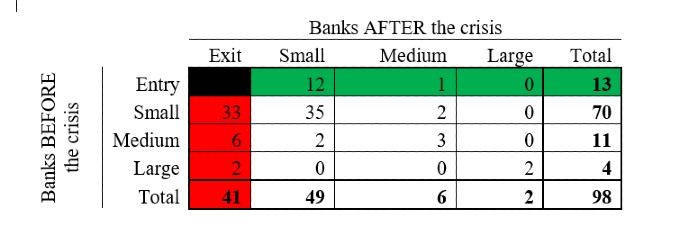
Obviously, the financial crisis was a devastating shock to the entire financial sector (and beyond). Over 300 small banks failed throughout the US, and Chicago was no exception. Roughly half of the banks that existed prior to the crisis were wiped out. The tables below indicate the large number of banks that exited the market (highlighted in red) as well as the handful of banks that entered (highlighted in green).


Despite the extreme turbulence, the groups were quite stable. Only a few banks moved between groups (from small to medium or vice versa). The vast majority of surviving banks remained in their original groups throughout the study (see Figure 1).

To summarize, an analysis of strategic groups can map the patterns of rivalry within an industry, and these structures can be remarkably stable even when devastating environmental shocks wipe out roughly half of the firms in the market. If you think that mapping the strategic groups might reveal some insights into the dynamics within your industry, please feel free to contact us to discuss setting up a study.
Charlie Carroll - c.carroll rug.nl

